Free TradingView indicator
Absorption Bubbles
Marks where aggressive orders into a high or low got absorbed.
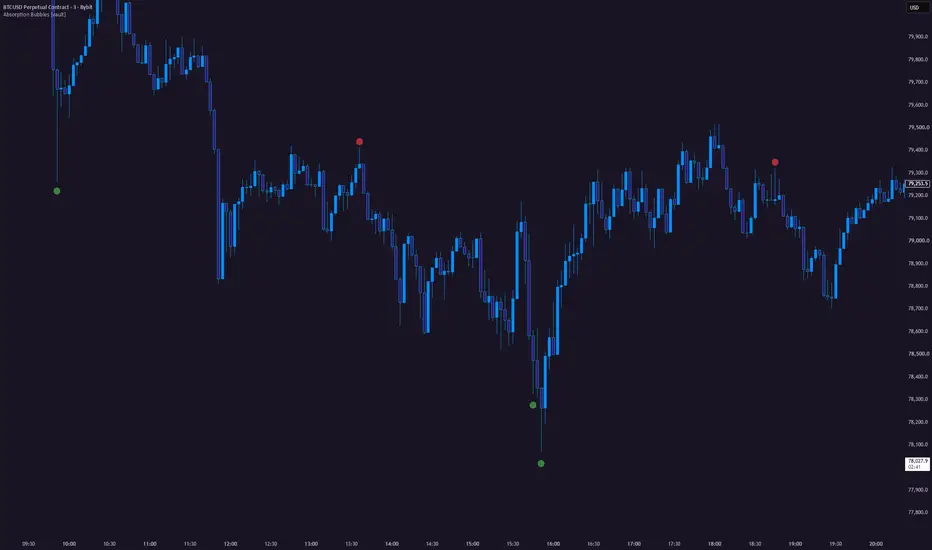
What Absorption Bubbles does
The move that fails usually tells you first, at the extreme, in the volume. A bubble prints where a swing high or low took a rejection wick on volume that does not belong there — buyers absorbing the push down, or sellers absorbing the push up.
What it draws on the chart
- Bubbles at swing extremes where volume clears an adaptive threshold
- Green for buyers absorbing lows, red for sellers absorbing highs
- Three size tiers, with an optional strength gradient
- The POC level for the absorbing bar, and alerts on each tier
How to get it
Absorption Bubbles is free. Open its TradingView page, add it to your favourites and it appears in the indicator list on any chart. No Payout Vault account is needed to use it.
The concept behind it
What it is not
An indicator marks what has already happened on the chart. It does not tell you to buy or sell, and it does not replace a plan with its own entry, invalidation and risk rules.
Other indicators.
- CRT EngineCandle Range Theory on the chart: the higher timeframe range, and how it gets taken.
- VWAP SuiteVWAP as a developing value area across every session, not one line.
- Dynamic Range ToolThe session range, its quarters, and the projections price is running into.
- Volume Delta SuiteBuy and sell pressure split out of the bar, instead of one volume column.
- Kernel BandsA kernel regression centreline with bands sized by how far price normally strays from it.
- SMT AutopilotSMT divergence that picks its own comparison assets, so there is nothing to configure.
- Sweep EngineMarks swept liquidity that got rejected, and scores how much agrees with it.
- SMT Autopilot+The member build of SMT Autopilot: every divergence scored by the full eight-factor engine.
- HOB / PHOB / BBHidden order blocks, Bojan triple sweeps and unfinished candles from ten timeframes, on one chart.